

Server logs
Server logs describe request handling and diagnostic observations. They are distinct from outbound postback delivery and conversion screening results. A completed scan observation does not prove end-to-end delivery or payment approval.
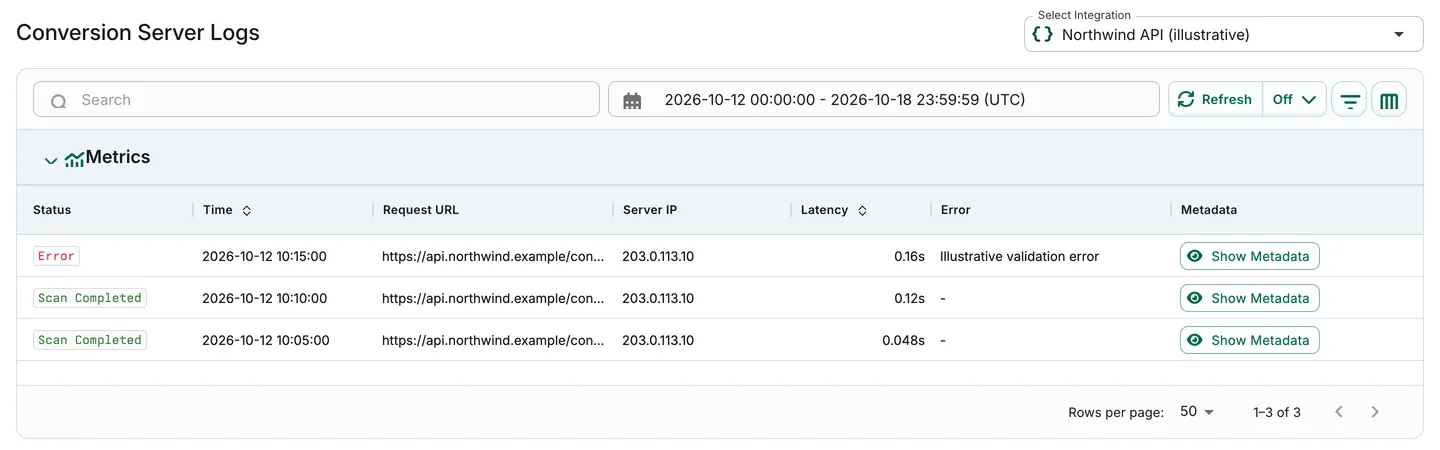
Illustrative synthetic scan-completed and error observations, not a real incident. This image shows Conversion Server Logs, not Attribution logs or Execution Trace.
Accessing server logs
Section titled “Accessing server logs”Open Server Logs and choose the appropriate request type:
- Conversion Logs: conversion calls without a click.
- Conversion Attribution Logs: attribution callbacks with a transaction ID; the page heading is Attribution Server Logs.
- Conversion Rejection Logs: conversion rejection requests.
Select an integration you can read and a date range, then narrow the available filters to the request being investigated. The Conversion Logs page heading is Conversion Server Logs.
Key features
Section titled “Key features”Inspect timestamps, transaction identifiers where present, request URL, status, latency, error, and metadata. Latency is the logged call’s elapsed time, not total queue or pipeline duration. Metadata about postback managers firing describes generation, not proof of HTTP delivery.
Investigation example
Section titled “Investigation example”In the fictional review, compare an error observation with nearby requests in the same integration and time window. Inspect available diagnostic metadata without assuming every observation represents a separate conversion. Remove secrets and personal information before sharing URLs or metadata.
Use Postback logs to check actual outbound HTTP attempts and Conversion reports for recorded screening decisions.